While it does take time to become proficient at applying technical analysis (or 'charting'), below are some basic ideas to help the reader get started in chart reading. These concepts (and others) will be used in charts throughout
TheMarket.co.za's weekly analysis report.
The building blocks of a chart:
- One of the main premises of technical analysis is that 'market action discounts everything' i.e. anything that can affect the price of a stock/index/currency etc is already reflected in the price itself. Price movement, then, is really a reflection of shifts in current supply and demand - if demand exceeds supply, the price rises. If supply exceeds demand, the price falls.
THREE TYPES OF CHARTS ARE:
| 1. Line Chart - |
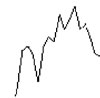 |
| Connects closing prices only |
|
| |
| 2. Bar Chart - |
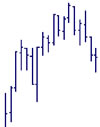 |
- Each 'bar' is the price range for one period (e.g. day, week etc).
- Shows the high, low, close and open of the period.
- The dash "-" on right side of bar is closing price, and on left side is opening price.
|
|
| |
| 3. Candlestick Chart - |
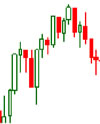 |
- Similar to bar chart, but emphasises the open - close relationship.
- Hollow candle (green): close is higher than open = an up-day
- Filled-in candle (red): close is lower than open = a down-day
|
|
BASIC CHARTING TECHNIQUES:
| Trendlines - |
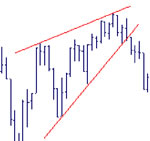 |
- They connect significant bottoms to each other (ie.support trendlines) or significant tops to each other (ie.resistance trendlines).
- Prices tend to 'bounce' off trendlines. Breakouts are violent.
|
|
| |
| Moving Averages - |
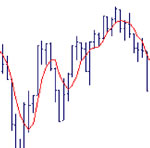 |
- Is the "average" price over X-number of time periods.
- A closing price above moving ave. is bullish; below it is bearish.
- Think of it as a 'moving' trendline.
|
|
| |
| Oscillators - |
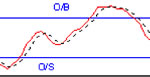
|
- The oscillator on top (e.g. Stochastic, Relative Strength Index) is based on a math formula that measures price relative to where it was X-number of time periods ago.
- Significant turning points in price often occur when the oscillator reverses at oversold (market bottoms) or overbought levels (market tops).
|
|
- Trendlines, moving averages, and oscillators will be used in our weekly analysis report, as well as other techniques of technical analysis, such as traditional chart patterns, Japanese candlestick patterns, Fibonacci studies, and Elliot Wave.
- The emphasis, however, will always be on simplicity and clarity of analysis, without ever compromising on accuracy and precision.